
On the French chart Plan de la rade de Gedda, Jeddah occupies a small part of a sheet mostly devoted to water. That balance tells you what the chart was made to explain. The city is a landmark on the shore, while the approach across the harbour is covered with measurements. If you know Al-Balad through its streets and markets, start with the water on this chart. The approach from the sea gives you a different way into the history of the same city.
What do the numbers on the water mean?
The David Rumsey Map Collection describes the depths as shown by soundings. Each figure records a depth measurement at a particular point. Enlarge the chart and follow a group of figures towards the shore. Notice where they cluster and how their spacing changes across the sheet. Use the legend or catalogue for the unit on the chart you are consulting. Different surveys and editions can use different units, and a bare number cannot safely be read in modern metres.
Find the city from the harbour side
Once you have looked at the soundings, move along the drawn shoreline and find the cluster marked as Jeddah. Compare the space given to details on land with the amount of information recorded offshore. The outline of the land gives the viewer a reference point. Water depths are recorded in much more detail. This way of drawing the harbour helps explain how a location familiar to present-day visitors looked to someone studying an approach from the Red Sea.
Why the catalogue dates differ
The Rumsey collection dates its version to an 1810 edition of Neptune Oriental. Wikimedia Commons dates the digitised copy illustrated here to around 1827. Both catalogue records attribute the work to Jean-Baptiste d’Après de Mannevillette. When you cite a chart, keep its catalogue and edition together. The date of a printed edition is useful for tracing how a chart circulated, while working out when the underlying field measurements were taken takes additional evidence.
Compare it with the 1864 Admiralty chart
Qatar National Library holds British Admiralty chart 2599, dated 1864. Its catalogue notes that it includes a coastal view of Jeddah Harbour from the anchorage. Open both charts and compare how they mark the shoreline and the city. Then look at the coastal view included on the Admiralty chart. A plan lets you study the positions of features from above, while the coastal view shows how part of the land could look to someone approaching at water level. The two views answer different questions about the same harbour.
Bring the comparison into an Al-Balad visit
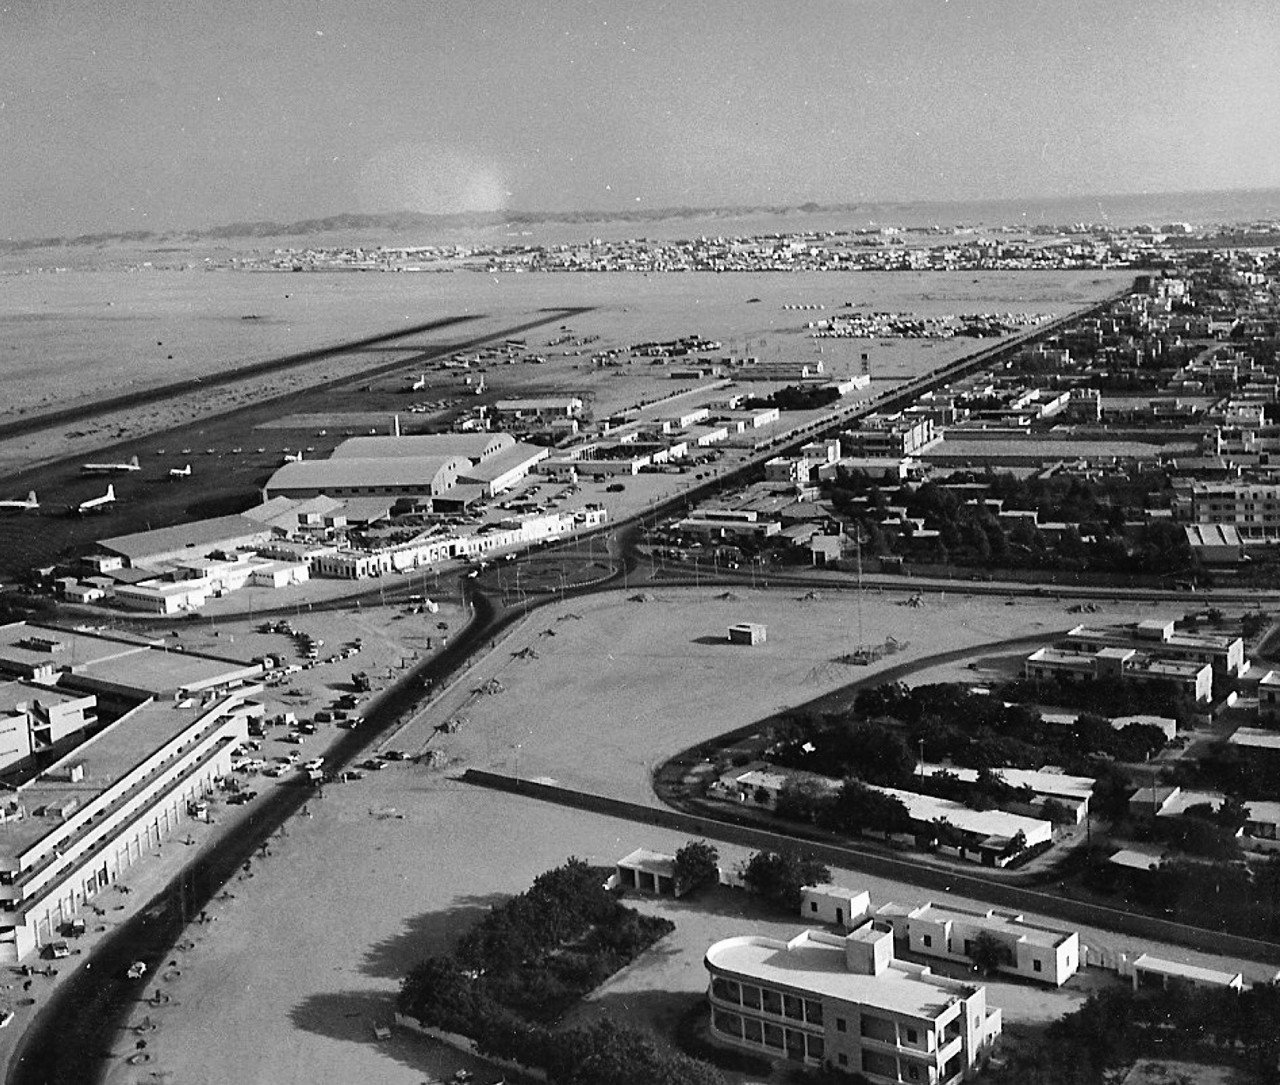
If your walk takes you near Al Arbaeen Lagoon, see the lagoon guide for the modern waterfront context. Then compare the chart with Jeddah’s 1938 aerial photograph. Notice how the photograph shows the concentration of rooftops, whereas the chart devotes much of the page to depths and the approach from offshore. The historic chart is an archival document. Use current official nautical charts for navigation.
Sources and featured image
David Rumsey Map Collection and Qatar National Library’s Admiralty chart record. The featured digitised copy of the French chart is marked public domain on Wikimedia Commons.
Planning a visit? Meet Adel Alsulami, your licensed Jeddah tour guide and discuss a private itinerary around your interests.